FREQUENCY ANALYSIS AND FREQUENCY ANALYZERS
Frequency Analysis and Frequency analyzers
Normally, sound and vibration phenomena occur with specific frequency characteristics. Multiple frequency components coexist in complex patterns.
Determining the respective levels of these frequency components is called frequency analysis.
Countermeasures for noise or vibrations will not be effective over the entire frequency range. Therefore, target values and evaluation criteria must be set separately for the various frequency bands.
Frequency analysis classification
Frequency analyzers can be grouped in various categories, according to usage purpose, as listed in Table 1.
|
Purpose |
Filter |
Frequency analyzer |
|---|---|---|
|
⚫︎Evaluation of sensory impact of sound and vibration ⚫︎Evaluation of unterm ⚫︎Materials development and evalution |
Constant ratio 1/1 octave band 1/3 octave band |
NA-28 SA-02 SA-A1RT(SA-A1) NX-63RT(NL-63) NX-43RT(NL-43) VX-57RT(VM-47) |
|
● ldenitify noise and vibration phenomena ● Noice and vibration countermeasure ● Materials development and eveluation |
Counstant width FFT (narrow-band analysis) |
SX-A1FT(SA-A1) SA-02 NX-43FT(NL-63/53/43) VA-12 NX-28FT(NA-28) |
|
① Frequency analyzers |
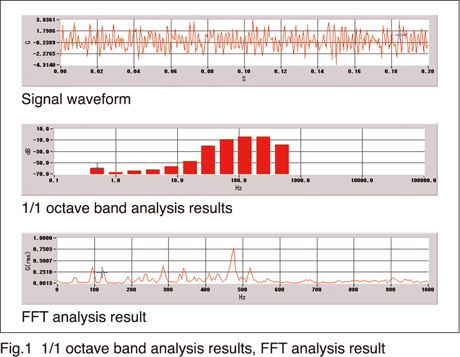
Devices for the frequency analysis of sound and vibrations can be divided into real-time analyzers and FFT analyzers, depending on their purpose. Figure 1 shows the analysis results of the same signal waveform processed on 1/3 octave band analysis and FFT analysis. A real-time analyzer employs a number of bandpass filters with a constant ratio (1/1,1/3,or 1/N octave bands). Frequency analysis performed with such a device serves mainly to assess the sensory impact of sound or vibration phenomena. The FFT analyzer is calculated by constant width band. Frequency analysis performed with such a device serves mainly to assess the physical magnitude of sound or vibration phenomena. |
|---|---|
|
② Constant ratio type filter and constant width type filter |
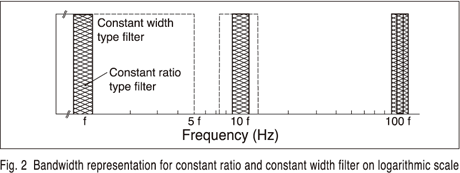
Filters used in frequency analyzers are of two types: constant ratio and constant width. In a constant ratio filter, the width of the passband varies in proportion to the center frequency while in a constant width filter, the passband width is always the same. Figure 2 illustrates the underlying principle. When a logarithmic scale is used for the frequency axis, the bandwidth of the constant ratio filter is shown as a constant, while the bandwidth of the constant width filter is shown as becoming narrower towards higher frequencies. When plotting frequency analysis results on a graph, it is therefore common to use a logarithmic frequency axis for a constant ratio ration filter and a linear scale for a fixed |
|
③ Filter specifications |
Octave band and 1/N octave band filters (analyzers) are specified in the IEC 61260 series and JIS C 1513 series. Filter standards are set by international standards, making it easy to compare data. There are no international standards for FFT analyzers. Therefore, analysis results may differ depending on performance and settings. |
Different Ways of Using Frequency Analyzers
|
① Real-time analyzer |
The most commonly used method for assessing the sensory impact of noise and vibration and for evaluating countermeasures is 1/1 octave and 1/3 octave analysis. Averaging can be carried out using the same frequency weighting and time weighting as the sound level meter or vibration level meter. This makes it possible to evaluate the actual impact that the noise or vibration phenomenon has on humans. The technique is used for many different tasks such as sound insulation measurements for architectural acoustics, evaluation of indoor noise, acoustic power level measurements, evaluation of building materials, sound quality evaluation, and propagation characteristics measurement. |
|---|---|
|
② FFT analyzer |
An FFT analyzer serves for assessing the physical aspects of sound or vibration phenomena and for devising suitable countermeasures. General applicability is good because analysis can be carried out in the time domain as well as in the frequency domain. Frequency resolution is excellent, which is essential for locating the sources of noise and vibrations, and the relationships between signals in multiple channels (for example, sound and vibration) can also be explored. FFT analyzers are extensively used in sound and vibration analysis of cars, machinery, computers, electric home appliances, etc., and in the development and evaluation of damping materials. Measurement types include mechanical impedance, mode analysis,intensity measurement, tracking analysis, propagation characteristics measurement,and sound quality measurement. FFT analyzers are indispensable tools in the Fight against noise and vibrations. |
FFT and Signal Processing
|
① FFT analyzer |
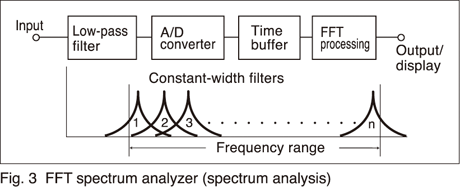
The result of FFT (Fast Fourier Transform) analysis is characterized by constant bandwidth. In the input of an FFT analyzer, a low-pass filter (anti-aliasing filter) is used to remove signal components other than those of the bandwidth to be analyzed. Then,the A/D circuit converts the input into a digital signal, and time window processing is carried out. Finally, FFT processing is performed, resulting in discrete frequency analysis. |
|---|---|
|
② Signal processing |
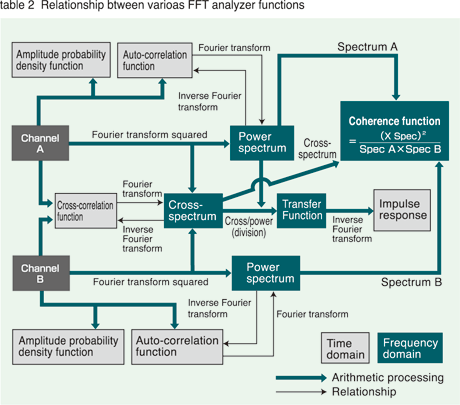
The FFT analyzer can also provide amplitude information and phase information. In the time domain, this includes time waveform, auto-correlation, cross-correlation, amplitude probability density function. In the frequency domain, spectrum, dual-channel cross-spectrum, transfer function, and coherence function can be calculated. Intensity measurement, as well as 1/1 and 1/3 octave band analysis (octave synthesis), can be carried out, and mode analysis and tracking analysis for the entire system are possible. |


